viernes, 4 de noviembre de 2011

Cost Functions

Hello everyone!

Our job this week was to formulate the costs function for the system. It is important for HAMBURGER’s manager to be able to measure the costs of the system because one of its jobs is to maximize the revenues given by the system operation. For this task, we include the following variables:

-          The expected number of entities in queue for the first station: WIPq. The costs function doesn’t include the expected number of entities in queue for the Cooking & Delivering and the Sauce stations because once the client pays, HAMBURGER doesn’t assume costs for queues in other stations.
-          The proportion of time that servers are idle. The costs function includes the cost of paying a server who is not working per minute.
-          We assume that a client who decides to enter into the system is willing to wait as long as it takes.
-          The cost associated to losing a client is the expected value of the purchase. This cost is particularly important because it represents a missed sale for HAMBURGER.
-          The cost associated to an unoccupied server is the wage per minute paid to an employee.
-          For a client to leave the restaurant, it is necessary that the WIPq for the Ordering station is 15 or greater.

The costs function is define as follows:

jueves, 20 de octubre de 2011

PERFORMANCE MEASURES - G/G/m SYSTEM

Hello everyone!
For this week, we have to compute the performance measures of the system, without failures and setups and including them.
For this calculation, we use the following relations according to Little’s Law:

ORDERING STATION


Including Failures
As we mentioned previously, the station number two has a failure which is the result of sporadic accidents because of misuse of knifes, shake milk machines or stoves. To calculate the average time between failures is necessary to take into account the rate, 0.00472 accidents/day which means 3.278E-06 accidents per minute, so mf is 305084,75 minutes.  Additionally, the average time of reparation is 30 minutes. In order to compute the performance measures of this station, it is important to calculate the percentage of time in steady state that the station is available to proceed, that we are going to represent with the letter A.


COOKING AND DELIVERING STATION


Model G/G/m including Failures
Now we develop the model with non-planned failures for accidents handling tools, knifes or machines.
The failures occurs with a rate of 0.00472 accidents/day, that means and accident occurs in average every 211.86 days or minutes
We observed a mean time of 5 minutes each time for any kind of accident.

As A tends to 1 the performance measures will be the same for the model without preempt and not preempt stops. The following table resumes the performance measures for this station.


SAUCE STATION
As we said before this station presents a setup that is when the  employees have to refill the sauce bottles, that takes 3 minutes and is every 100 clients, according to this, we proceeded to calculate how long a client is in the row and how many customers are going to be on the station at any time. For the computation of the performance measure, we said that the station has 3 servers.
First we proceeded to calculate the arrival coefficient of variance, the effective time and the variance of the effective time having clear that the refilling time is a setup and not a failure.


Secondly, modeling the station as a G/G/M we computed the time that a client is in the row with the utilization of the station,


Finally, the same variables were calculated without the refilling time to look how this setup affected the quantity and time that customers were in the station.


Model G/G/m including Failures


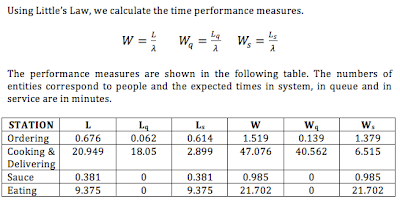
Using Little’s Law, we compute the expected number of customers in system, in queue and in service, obtaining the following table.


EATING AREA STATION


According to G/G/m systems, we calculate the expected time in queue whit the next formula:


Using Little’s Law, we have the following resume table, for this station.


We hope you enjoyed the entry.

Nataly Patacón
Camila Fonseca
Alejandro Moreno
Freddy Guevara


lunes, 3 de octubre de 2011

HAMBURGER AS A G/G/m SYSTEM

Hello everyone!

For this week, we have to model the system based on the real distributions of times, obtained a few weeks ago with Crystal Ball.
We only have the distribution of the external inter-arrival time, we assume that the time of the arrivals for all stations is distributed as the external time. The distributions of the inter-arrival time for each station is Extreme Value, affected by the routing probabilities.
Times, failures and setups are presented for the full period, which means that HAMBURGER is full from 12-2 pm.

The description for each station is based on the next formulation.

ORDERING:

1. The distribution of the inter-arrival time is Extreme Value with the following parameters.
     Mean: 2.2 minutes
     Variance: 20.7 minutes^2

2. The distribution of the service time is Gamma with the following parameters.
     Mean: 1.4 minutes
     Variance: 0.9 minutes^2

3. This station has 2 servers.


     Setups and Failures

This station presents a possible setup is when the billing paper ends. The cashier has to open a drawer and put the new billing paper in the machine. This operation last 2 minutes. This setup occurs every 150 clientes.

The software can fail and the entity has to wait to keep ordering his meal. This failure occurs once a month.  The repairing time is 3 minutes while the cashier restart the machine.


COOKING AND DELIVERING:

1. The distribution of the inter-arrival time is Extreme Value with the following parameters.
     Mean: 2.2 minutes
     Variance: 20.7 minutes^2

2. The distribution of the service time is Lognormal with the following parameters.
     Mean: 6.5 minutes
     Variance: 7.6 minutes^2

3. This station has 3 servers.


According to the possible failures mentioned in previous entries, for the Cooking and Delivering station the possible failure correspond to accidents with tools as knifes or machines. This type of failure is very weird. It can occur with a rate of 0,00472 accidents/day.


     Setups and Failures


We analyze the system when it is full, so, HAMBURGER has strict schedules. Thus, the employees have to go to the restroom and have lunch before or after the full time. That's why this stations has no setups or failures, regarding to employee's physiological needs.


SAUCE STATION:

1. The distribution of the inter-arrival time is Extreme Value with the following parameters.
     Mean: 1.914 minutes
     Variance: 15.6678 minutes^2

2. The distribution of the service time is Beta with the following parameters.
     Mean: 1.0 minutes
     Variance: 0.7 minutes^2

3. This station has infinite servers.


     Setups and Failures


This station presents a setup regarding the sauces. HAMBURGER employees have to refill the sauce bottles every 100 clients. The  refilling time is approximately 3 minutes.

This station has no possible failures, because is a self-server station and the service time depends on the client.


EATING AREA:

1. The distribution of the inter-arrival time is Extreme Value with the following parameters.
     Mean: 2.42 minutes
     Variance: 25.047 minutes^2

2. The distribution of the service time is Lognormal with the following parameters.
     Mean: 21.7 minutes
     Variance: 117.2 minutes^2

3. This station has infinite servers.


     Setups and Failures


This station has no setups or failures because is a self-server station.

lunes, 19 de septiembre de 2011

Model Suggestions Based on Other Blogs


For this week, we have to review other similar projects and find possible improvements for our project. Consulting three different blogs, we have the following conclusions:

Our system could have one extra station, corresponding to the trash. It means that the client, after eating his meal, goes to the trash and leaves the table clean, before getting away HAMBURGER. The routing probability of this station is one when the client comes from the "Eating Area" station. There are not arrivals from other stations to the "Trash" station.
Blog: 
http://hamburgueserias.blogspot.com/

The possible failures for our system are greater than we mentioned before. At the "Ordering" station, an additional set-up is that there is no more billing paper, and the cashier has to put it in the register.  Another possible failure is that there is no change for the client and the cashier has to ask to the other server for exchange some money. Finally, it can appear a failure when the product that the client wants to order is not available in the system. Thus, the client has to think about another product in the menu.
Blog:
http://e9-restaurantes.blogspot.com/

For our system, it is possible that a client arrives to the system and decide not to get in because the place is crowded. The decision is based on the number of people in queue. If the queue is apparently long, then the client prefers going somewhere else.
Blog:
http://fastproyectb3.blogspot.com/

The mentioned blogs were chosen according to the following reasons:
·         The systems are based on a fast-food restaurant, where the speed of service is mainly important to improve customer service. That’s why restaurants avoid making their clients to wait for so long in line. Thus, it is expected that the number of clients in queue is minimal.
·         The products that are offered are: hamburgers, salads, bakery products, French fries, and so forth.
·         There is optional for the client to go to a particular station, because it depends on his willingness. For example, a costumer who does not want to get sauces, sugar, salt, etc. Or there is the possibility that he wants his meal to-go.
·         Service takes place in two ways. First, there are people who take and deliver the order. Second, there is self-service for each client.
We hope you enjoyed our entry.
Thank you for reading us,
Nataly Patacón
Camila Fonseca
Fernand Malagón
Alejandro Moreno

lunes, 12 de septiembre de 2011

PERFORMANCE MEASURES

This week we have to calculate performance measures for the restaurant HAMBURGER, but assuming that the distribution of the inter-arrival times and service times is exponential. This assumption is very important to apply Jackson’s theorem and modeling the system as a Jackson network.

Thus, by Jackson’s theorem, the arrival rates are calculated with the following expression:


The system of equations of the total arrival rates of HAMBURGER is:


 Looking at the graph schema, in “System Data” publication, the system of equations is simplified as it’s shown. 


We assume that our system satisfy Jackson’s suppositions (exponential inter-arrival times, exponential service times, infinite capacity for all stations and reached stable state λi<sii for all i stations). Then, the arrival rates found correspond to inter-arrival times distributed exponential. In order to calculate performance measures, we use network formulas, shown in the next table.


We hope you enjoyed our entry.
Thank you for reading us,

Nataly Patacón
Camila Fonseca
Fernand Malagón
Alejandro Moreno

viernes, 2 de septiembre de 2011

SYSTEM DATA - TIMES DISTRIBUTION

Hello everyone!
This week we had to find the distribution of the inter arrival time and service time of each station. For this task, we applied goodness-of-fit test for each station service time and for the inter arrival time, by using an statistical software (Crystal Ball). The results are presented in the next charts.

The following graphs show the closest distribution found by the software. However, none distribution fitted perfectly to our taken times.


In order to find distributions, the following tables show how to calculate the mean and the variance for  each one. The results for the distribution of the service times, and the inter-arrival time, are shown in the second table.


Time Units in minutes.


Thank you for reading us!
Regards,

Nataly Patacón
Camila Fonseca
Fernand Malagón
Alejandro Moreno

lunes, 29 de agosto de 2011

SYSTEM DATA

Our job this week was visiting the system and taking some data. We had to register the arrivals and the service times for 100 entities.

Thus, we define the different routes that can follow an entity. 
A client who enters to HAMBURGER restaurant have to get into the line to arrive to the first station, which is "Ordering". Then, he has to wait his meal at the "Cooking and Delivering" station. 
From this last station he can leave the restaurant, or continue in the following routes:
- Go to the sauce station and leave de restaurant.
- Go to the sauce station and then to the "eating area".

When the client continues in the second route, he leaves HAMBURGER after he eats his meal at the fourth station "Eating Area". 
The typical route corresponds to: Ordering - Cooking and Delivering - Sauce - Eating Area - Exit.

The service time for each of the stations are in the graph schema. The summary of the data is at the following table:


We hope you enjoyed our entry.
Thank you for reading us.


Regards,


Nataly Patacón
Camila Fonseca
Fernand Malagón
Alejandro Moreno